2026-07-29 · Dr. NoVo
NoVo Analyst · Closing Bell Synopsis
Structural Bias · BEARISH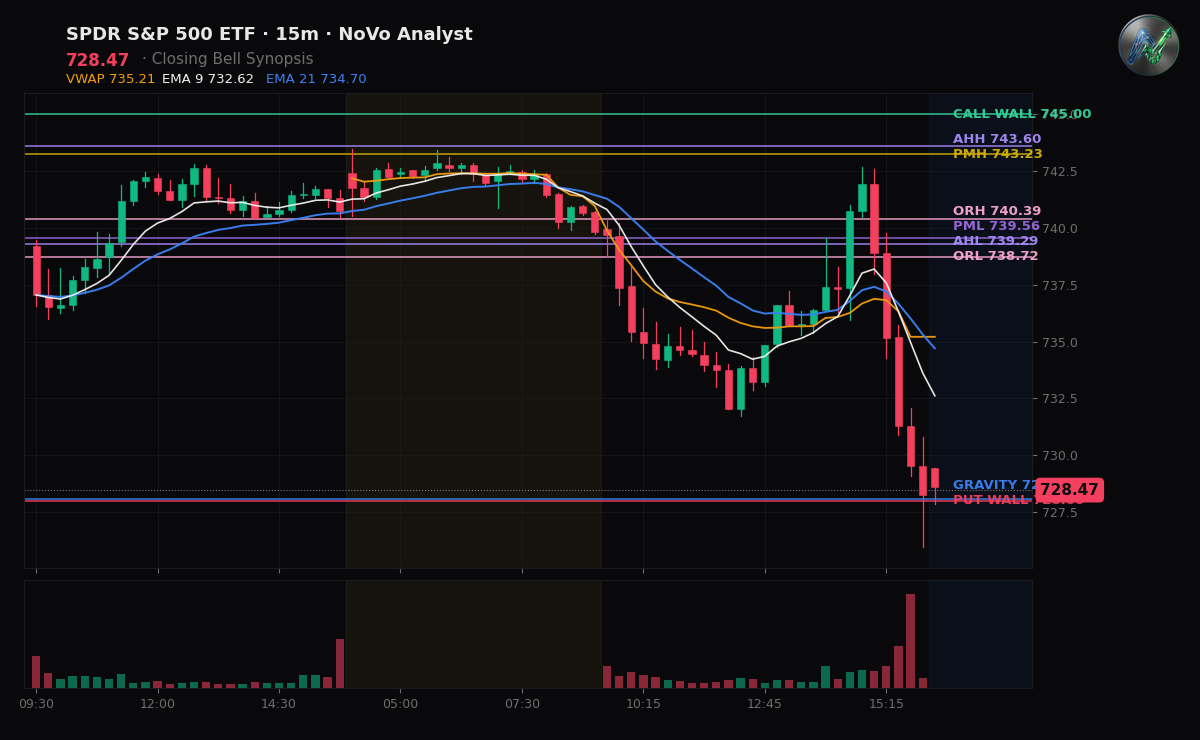
BOTTOM LINE: A hawkish 9–3 Fed pause paired with surging crude oil triggered synchronized selling across broad equities, leaving all three benchmark ETFs locked in short-dealer amplification below key session levels.
THE RECAP
Broad equities suffered widespread selling into the bell, with SPY ($728.47), QQQ ($661.10), and IWM ($287.84) settling lower in tight directional alignment. The session character was a persistent trend-down liquidation as markets digested the Federal Reserve holding benchmark rates at 3.50%–3.75% alongside three hawkish dissents and energy-driven inflation risks. SPY broke decisively below its opening range low (738.72) and prior-day low (735.98) to close well beneath its session VWAP, while tech-heavy QQQ and small-cap IWM matched the downside momentum without any sector rotation or relative strength to absorb the flow.
DEALER POSITIONING
End-of-day options structure reflects a short-dealer regime across all three benchmark funds, converting market makers from liquidity providers into volatility amplifiers. In SPY, net gamma sits deeply negative at -$4.6B, forcing dealers to sell into falling prices and expanding directional moves rather than dampening them. QQQ and IWM mirror this unhedged posture, leaving the entire equity complex without structural dealer support overhead or nearby gamma-flip buffers. The standing options order book remains tilted net-short delta with substantial daily theta decay, imposing heavy premium drag on long positions if price consolidates near local support.
TOMORROW'S SETUP
Heading into tomorrow, SPY must defend its put wall and gravity magnet zone at 728.00–728.07; a breakdown beneath this level accelerates downside discovery toward lower structural support. On any relief bounce, initial overhead resistance rests at the prior-day low of 735.98, followed by the opening range low at 738.72 and pre-market low at 739.56. For QQQ and IWM, track whether buyers can reclaim today's breakdown levels to stabilize the tape; failing to cross early resistance leaves both technology and small caps exposed to further amplified selling under negative market-maker gamma.
DEALER POSITIONING MAP · SPY / QQQ / IWM
Vol environment: VIX 20.7 — 84th percentile of the past year (elevated vol).
SPY $728.49
Net GEX: -$4.6B · negative — dealers amplify moves (moves extend)
Gravity (magnet): $728.07
Call Wall: $745.00 Put Wall: $728.00
Expected move: ±$9.48 (±1.3%) today · ±$21.20 (±2.9%) this week
Put/Call skew: -10.5 vol pts · calls bid — upside chase / complacency
MM skew · 0DTE -10.5 / next +1.2 vol pts · 0DTE complacency vs the next expiry
ATM IV: 20.7%
QQQ $661.14
Net GEX: -$2.6B · negative — dealers amplify moves (moves extend)
Gamma Flip: $680.47
Gravity (magnet): $661.32
Call Wall: $685.00 Put Wall: $660.00
Expected move: ±$17.39 (±2.6%) today · ±$38.89 (±5.9%) this week
Put/Call skew: -2.0 vol pts · calls bid — upside chase / complacency
MM skew · 0DTE -2.0 / next +2.3 vol pts · 0DTE complacency vs the next expiry
ATM IV: 41.8%
IWM $287.84
Net GEX: -$2.2B · negative — dealers amplify moves (moves extend)
Gamma Flip: $295.27
Gravity (magnet): $286.31
Call Wall: $297.00 Put Wall: $285.00
Expected move: ±$5.56 (±1.9%) today · ±$12.43 (±4.3%) this week
Put/Call skew: +4.3 vol pts · puts bid — downside hedging demand
MM skew · 0DTE +4.3 / next +3.9 vol pts · 0DTE fear building vs the next expiry
ATM IV: 30.7%
Gamma Flip = where dealer hedging flips from dampening to amplifying moves. Call/Put Walls = the largest call/put gamma strikes (pin / resistance above, support below). Expected move = the ±1σ range priced into at-the-money options. Public options data.
FLOW DYNAMICS
Charm — in a negative-gamma regime decay didn't pin, so moves could extend into the close rather than settle. Vanna — with dealers short gamma, a drop in vol would ease the amplification and let the tape settle. Second-order dealer flow context.
Key Levels