2026-08-11 · Dr. NoVo
NoVo Analyst · Closing Bell Synopsis
Structural Bias · BEARISH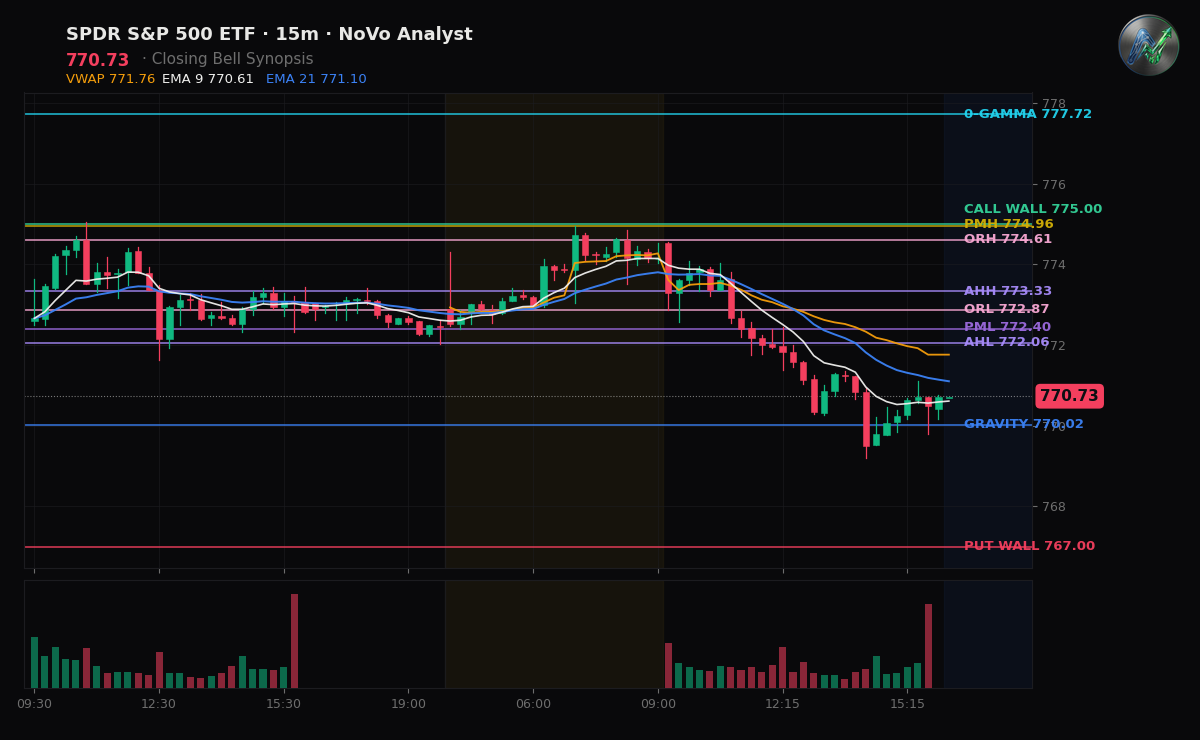
BOTTOM LINE: Equities broke lower into the close as broad-market and tech selling broke structural support ahead of Wednesday's inflation print, while small caps demonstrated notable relative resilience.
THE RECAP
The index complex delivered a split session marked by afternoon weakness in large caps and steady holding in small caps. SPY ($770.73) declined -0.30%, breaking below its opening range low ($772.87) and yesterday's low ($771.89) to close under session VWAP as investors maintained defensive positioning ahead of Wednesday's July Consumer Price Index release. QQQ ($718.48) mirrored this broad-market softness, sliding alongside mega-cap tech as market participants digested sticky energy prices driven by Middle East friction against July's preliminary -23,000 nonfarm payroll contraction. In contrast, IWM ($301.04) diverged from the large-cap drift, holding firmly above its key $300 threshold to reflect localized small-cap outperformance.
DEALER POSITIONING
Market maker posture reflects a clear mechanical divergence across the benchmark suite. SPY has flipped into negative net-gamma territory at -$1.1B, placing dealers in an amplifying stance where hedging flows accelerate price momentum into weakness rather than dampening it. QQQ similarly operates under sell-side pressure where market maker flows offer minimal shock-absorption against downside trends. Conversely, IWM remains anchored in positive net-gamma territory, obligating dealers to trade counter to directional flow—buying localized dips and smoothing price action. Across the public options chain, open interest carries a net-short delta tilt (~-0.3M delta-equivalent) alongside ~$8.8M in daily theta decay, creating a steady drag on holding non-directional long positions.
TOMORROW'S SETUP
For SPY, reclaiming session resistance at $771.89 (yesterday's low) and $772.87 (the opening range floor) is required to relieve negative-gamma pressure and set up a recovery toward $773.33 (after-hours high) and $774.96 (pre-market high). Failure to clear $771.89 keeps dealers in an amplifying posture, leaving support exposed down to $770.02 (the gravity magnet) and $767.00 (the put wall). For QQQ, buyers must stabilize tech flows above immediate downside support to launch a mean-reverting push toward upper resistance. For IWM, maintaining trade above the $300.00 floor preserves small-cap relative strength, whereas a break back below that pivot would collapse the divergence and realign it with broad-market weakness.
DEALER POSITIONING MAP · SPY / QQQ / IWM
Vol environment: VIX 15.3 — 11th percentile of the past year (very low vol).
SPY $770.69
Net GEX: -$1.1B · negative — dealers amplify moves (moves extend)
Gamma Flip: $777.72
Gravity (magnet): $770.02
Call Wall: $775.00 Put Wall: $767.00
Expected move: ±$6.89 (±0.9%) today · ±$16.59 (±2.1%) this week
Put/Call skew: +0.9 vol pts · roughly balanced
ATM IV: 14.2%
QQQ $718.48
Net GEX: -$115M · negative — dealers amplify moves (moves extend)
Gamma Flip: $720.38
Gravity (magnet): $718.03
Call Wall: $725.00 Put Wall: $710.00
Expected move: ±$9.52 (±1.3%) today · ±$22.65 (±3.1%) this week
Put/Call skew: +1.6 vol pts · puts bid — downside hedging demand
MM skew · 0DTE +1.6 / next +1.8 vol pts · front term structure flat
ATM IV: 21.0%
IWM $301.04
Net GEX: +$232M · positive — dealers dampen moves (grind / mean-revert)
Gamma Flip: $296.57
Gravity (magnet): $302.97
Call Wall: $305.00 Put Wall: $299.00
Expected move: ±$4.22 (±1.4%) today · ±$9.43 (±3.1%) this week
Put/Call skew: +2.0 vol pts · puts bid — downside hedging demand
MM skew · 0DTE +2.0 / next +2.1 vol pts · front term structure flat
ATM IV: 22.2%
Gamma Flip = where dealer hedging flips from dampening to amplifying moves. Call/Put Walls = the largest call/put gamma strikes (pin / resistance above, support below). Expected move = the ±1σ range priced into at-the-money options. Public options data.
FLOW DYNAMICS
Charm — in a negative-gamma regime decay didn't pin, so moves could extend into the close rather than settle. Vanna — with dealers short gamma, a drop in vol would ease the amplification and let the tape settle. Second-order dealer flow context.
Key Levels