2026-08-14 · Dr. NoVo
NoVo Analyst · Pre-Market Primer
Structural Bias · NEUTRAL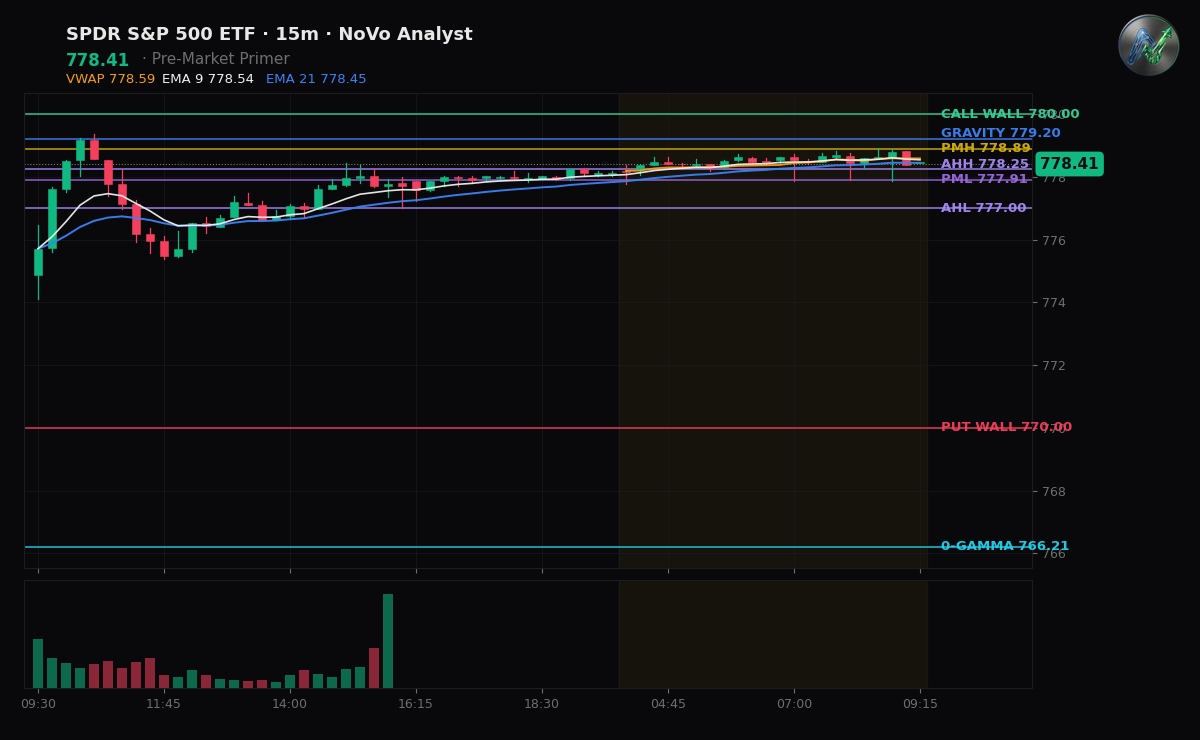
BOTTOM LINE: Soft retail sales and a sticky core PPI print set up a two-way, absorption-heavy open across the index complex, with dealer posture favoring mean-reversion unless key intraday supports give way.
THE SETUP
Index futures hold a modest pre-market bid following July retail sales, which fell 0.6% month-over-month to signal cooling consumer demand. This spending drop follows earlier soft headline CPI and PPI readings that lifted broad equities, though a 0.4% MoM rise in core producer prices keeps inflation metrics active in the background. S&P 500 futures continue to float above short-term VWAP and overnight liquidity, pointing to an orderly opening gap rather than runaway momentum. Traders should expect early range consolidation as the market digests the consumer spending slowdown ahead of upcoming Fed policy commentary.
DEALER POSITIONING
Market maker posture across SPY, QQQ, and IWM sits in positive net-gamma territory across the board. In this regime, dealers act as liquidity providers who mechanically sell strength and buy dips, suppressing intraday volatility and pulling spot price back toward heavy open-interest pins. Positioning remains directionally aligned across all three ETFs, though tech-heavy QQQ displays higher implied volatility than small-cap IWM. The options chain reflects a balanced delta posture paired with ongoing daily time decay, imposing a structural holding cost on unhedged long premium as price grinds inside established boundaries.
LEVELS TO WATCH
For SPY ($778.41), holding immediate support at $777.91 (pre-market low) and yesterday's low at $774.11 keeps the broader structural bid intact. Reclaiming resistance at $778.89 (pre-market high) opens the path toward $779.37 (yesterday's high) and the $780.00 call wall. For QQQ ($733.75) and IWM ($303.46), maintaining trades above their respective positive-gamma support floors is essential to keep market makers in a stabilizing posture; a sustained break beneath those levels would flip dealer hedging from dampening volatility to accelerating downside flow.
DEALER POSITIONING MAP · SPY / QQQ / IWM
Vol environment: VIX 14.5 — 4th percentile of the past year (very low vol).
SPY $778.40
Net GEX: +$9.8B · positive — dealers dampen moves (grind / mean-revert)
Gamma Flip: $766.21
Gravity (magnet): $779.20
Call Wall: $780.00 Put Wall: $770.00
Expected move: ±$9.33 (±1.2%) today · ±$20.85 (±2.7%) this week
Put/Call skew: +0.9 vol pts · roughly balanced
MM skew · 0DTE +0.9 / next +0.5 vol pts · 0DTE fear building vs the next expiry
ATM IV: 19.0%
QQQ $733.73
Net GEX: +$1.9B · positive — dealers dampen moves (grind / mean-revert)
Gamma Flip: $727.97
Gravity (magnet): $734.07
Call Wall: $735.00 Put Wall: $728.00
Expected move: ±$7.53 (±1.0%) today · ±$21.94 (±3.0%) this week
Put/Call skew: +2.0 vol pts · puts bid — downside hedging demand
MM skew · 0DTE +2.0 / next +1.6 vol pts · 0DTE fear building vs the next expiry
ATM IV: 16.3%
IWM $303.46
Net GEX: +$555M · positive — dealers dampen moves (grind / mean-revert)
Gamma Flip: $300.91
Gravity (magnet): $303.77
Call Wall: $304.00 Put Wall: $300.00
Expected move: ±$2.61 (±0.9%) today · ±$7.54 (±2.5%) this week
Put/Call skew: +0.9 vol pts · roughly balanced
MM skew · 0DTE +0.9 / next +0.9 vol pts · front term structure flat
ATM IV: 13.7%
Gamma Flip = where dealer hedging flips from dampening to amplifying moves. Call/Put Walls = the largest call/put gamma strikes (pin / resistance above, support below). Expected move = the ±1σ range priced into at-the-money options. Public options data.
FLOW DYNAMICS
Charm — as today's options decay, dealer delta drifts toward the walls: a mild pull into the close (the pin). Vanna — vol is low and dealers are long gamma; a VIX spike would flip them toward selling into weakness (amplifying) — the risk that changes the map. Second-order dealer flow context.
Key Levels