2026-08-18 · Dr. NoVo
NoVo Analyst · Closing Bell Synopsis
Structural Bias · BEARISH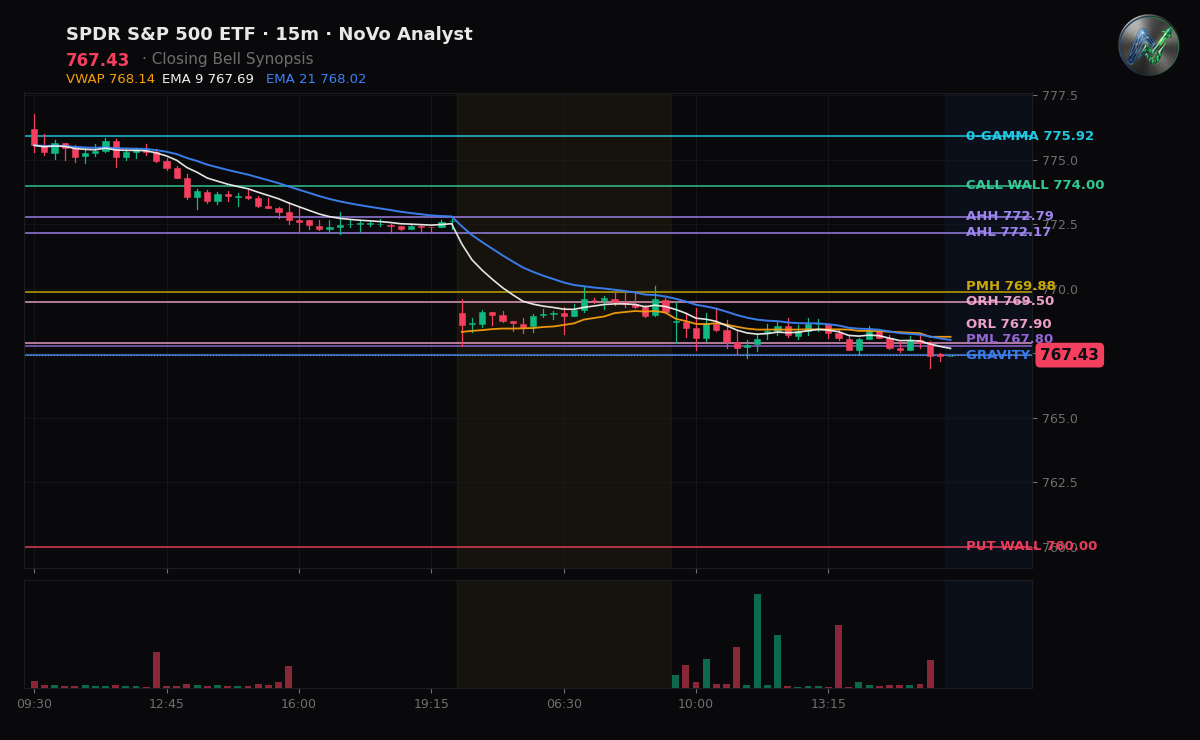
BOTTOM LINE: Macro headwind and energy shocks drove a synchronized liquidation across broad equities, tech, and small-caps, locking all three index benchmarks below session VWAP into tomorrow's open.
THE RECAP
Sellers held decisive control through Tuesday, forcing SPY down -0.68% to $767.43, QQQ to $717.36, and IWM to $300.12 in a unified downside drive. The broader index complex failed to sustain early micro-bounces, bleeding below intraday VWAP as energy costs surged past $90 a barrel following the expiration of the U.S.-Iran ceasefire framework. Tech lead and broad market shares fell in tandem as the 30-year Treasury yield pressed to 19-year highs near 5.33%, leaving small-caps in IWM equally pressured under elevated capital costs.
DEALER POSITIONING
Market maker positioning shows a unified negative-gamma footprint across SPY, QQQ, and IWM. In this environment, dealer hedging mechanics cease to absorb intraday directional flow and instead act as an amplifier, forcing liquidity providers to sell into spot declines and buy into rallies. Across the broader options chain, standing positioning maintains a net-short delta tilt paired with continuous daily theta decay, creating a persistent holding penalty on long exposure while volatility expansion risk favors downside tail protection over unconfirmed long bounces.
TOMORROW'S SETUP
For SPY, buyers face an immediate structural test at $767.80 to prevent a deeper slide toward downside gravity at $767.10 and the primary put wall at $760.00. Reclaiming pre-market resistance at $769.88 is required to alleviate immediate pressure and open a path toward the $774.00 call wall, though spot price remains structurally constrained below the $776.67 gamma-flip level where dealers remain in an amplifying posture. For QQQ and IWM, watch whether spot price can hold local support or reclaim their respective gamma-flip thresholds; remaining pinned below these levels keeps market maker flows in an amplifying stance, leaving tech and small-caps vulnerable to further downside expansion.
DEALER POSITIONING MAP · SPY / QQQ / IWM
Vol environment: VIX 15.8 — 23th percentile of the past year (low vol).
SPY $767.40
Net GEX: -$944M · negative — dealers amplify moves (moves extend)
Gamma Flip: $776.67
Gravity (magnet): $767.10
Call Wall: $774.00 Put Wall: $760.00
Expected move: ±$5.42 (±0.7%) today · ±$17.12 (±2.2%) this week
Put/Call skew: +1.9 vol pts · puts bid — downside hedging demand
ATM IV: 11.2%
QQQ $717.39
Net GEX: -$840M · negative — dealers amplify moves (moves extend)
Gamma Flip: $727.62
Gravity (magnet): $715.99
Call Wall: $735.00 Put Wall: $715.00
Expected move: ±$8.33 (±1.2%) today · ±$22.78 (±3.2%) this week
Put/Call skew: +4.3 vol pts · puts bid — downside hedging demand
MM skew · 0DTE +4.3 / next +4.7 vol pts · 0DTE complacency vs the next expiry
ATM IV: 18.4%
IWM $300.12
Net GEX: -$119M · negative — dealers amplify moves (moves extend)
Gamma Flip: $304.53
Gravity (magnet): $299.46
Call Wall: $305.00 Put Wall: $300.00
Expected move: ±$3.01 (±1.0%) today · ±$8.14 (±2.7%) this week
Put/Call skew: +2.8 vol pts · puts bid — downside hedging demand
MM skew · 0DTE +2.8 / next +2.7 vol pts · front term structure flat
ATM IV: 15.9%
Gamma Flip = where dealer hedging flips from dampening to amplifying moves. Call/Put Walls = the largest call/put gamma strikes (pin / resistance above, support below). Expected move = the ±1σ range priced into at-the-money options. Public options data.
FLOW DYNAMICS
Charm — in a negative-gamma regime decay didn't pin, so moves could extend into the close rather than settle. Vanna — with dealers short gamma, a drop in vol would ease the amplification and let the tape settle. Second-order dealer flow context.
Key Levels